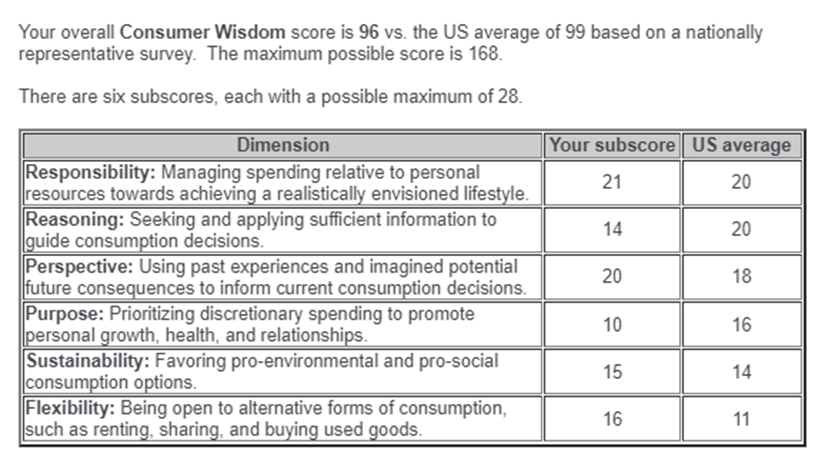
After completing the Consumer Wisdom survey, you’ll receive your computed overall score as well as subscores for each dimension (I hope you wrote these down!). These scores are raw scores. Here’s an example that we’ll walk through:
I’m about to tell you how to use your raw subscores to compute your relative subscores. While this isn’t absolutely essential (since you can already tell which are higher or lower vs. US averages), the relative scores will help you get a better sense of how much higher or lower your scores are vs. national averages by placing the scores into quintile brackets (hold on, this will make sense in a minute…).
To compute your relative dimension subscores, simply subtract the US average from each raw subscore, which may result in a positive or negative number; this is your relative subscore for each dimension. Then, add up all of your dimension relative subscores (the column of scores) to get your overall Consumer Wisdom relative score. Here is what it looks like for the example score sheet above:
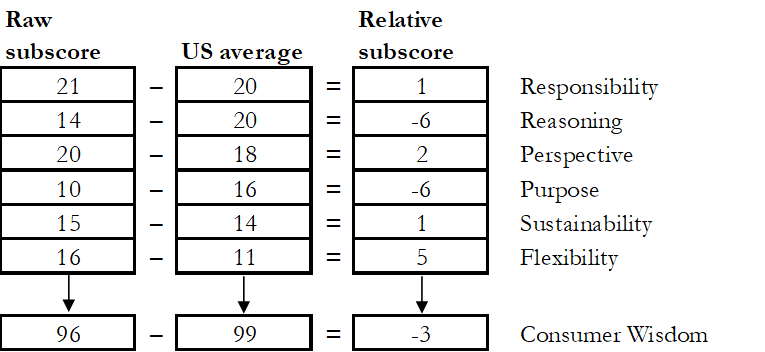
Now, focusing on your relative score for consumer wisdom overall (which is -3 for the example above; see the bottom right corner), you can get a sense of how you compare with the national sample using the following scale with five quintiles, each representing 20% of the US population:
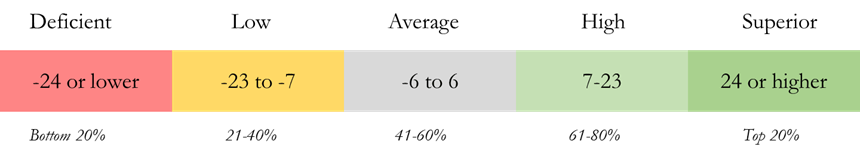
For our example scoresheet, their overall score of -3 puts them in the middle quintile (in other words, average; which is not a bad place to start!).
Don’t worry at all if your own overall relative score isn’t “high” or “superior.” If that is the case, it simply means that there is a lot of upside to improve – that is the whole point of doing this. If you did score “high” or “superior,” that’s great – but you’ll also find opportunities to improve considering that the highest overall relative score is 69 (or 168 total possible points less the 99 average score for the overall US population). Overall relative scores above 42 are uncommon, representing only about 10% of the population (and a score of 63 would put you in the top 1%!).
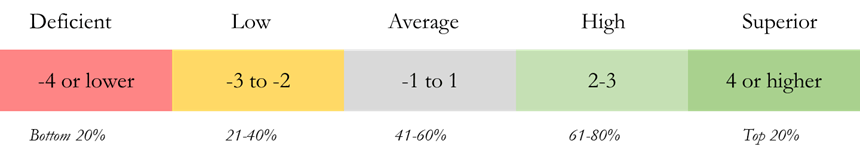
Opportunities for growth will also be more evident as we look at the relative dimension subscores. Using the scale below, you can evaluate your relative consumer wisdom score for each dimension. Repeat this for each of your dimension relative subscores, paying attention to which of your dimension subscores are lower than, or higher than, the national averages for each dimension.
For our example set of scores, relative strengths include Perspective (a “high” score of 2) and Flexibility (a “superior” score of 5), and relative weaknesses include Reasoning and Purpose (both with “deficient” scores of -6).
Now turn back to your own scores. It’s possible that all of your dimension relative scores are below the national averages, or above national averages. Note, too, that the national US average raw score varies by dimension, from a low of 11 (Flexibility) and 14 (Sustainability) to a high of 20 (for both Responsibility and Reasoning). What this means is that the US population, on average, is less consistent with putting into practice behaviors related to Flexibility and Sustainability, and more consistent with Responsibility and Reasoning (with Purpose and Perspective somewhere in the middle). We’ll get into some details about these dimensions in a bit, but it will soon make sense when you consider that the behaviors related to Flexibility and Sustainability are just less common in today’s global economy. We’re not used to buying used goods (Flexibility) or buying products that explicitly promote environmental or social responsibility (Sustainability). And there is simply less opportunity to do so, although that is changing quickly. On the other hand, we are more used to the idea of Reasoning our way through existing choices in the market – getting information about products and searching for the best deals, for example. So, while your journey is a personal one, the context for this is important. Although companies and cultures are evolving, change feels slow and, at least in the “economically developed” world, we still live in a large-corporation dominated mainstream market that favors new products, novelty, and at least the appearance of a deal.
Comparing your scores to these national averages is helpful – and is one of the first things that people who take the survey want to know. But, each person’s situation and journey is different. So, once you have computed these scores and compared them with national averages, shift your attention back to what you expected for each dimension. Looking back at your dimension raw scores again, were you surprised by which were higher, or lower, than the others? What are your strengths and what might be your biggest opportunities for growth? Also, keep in mind that this survey gives you a good but imperfect snapshot – or impression – of your consumption-related behaviors today. Don’t ignore your own intuition about where your greatest strengths and opportunities lie, which you will get a better sense of as we move next into looking at each dimension in a bit more detail.
