Now that you have your own consumer wisdom scores and a better sense of what they mean, you need to make some decisions about where to go from here. Next, we’re going to explore the idea of different types of consumers. On the one hand, each of the dimensions of consumer wisdom is relatively independent; they are all related at some level, but distinct. You could simply focus on individual dimensions that you scored the lowest on, which you could base on either your raw scores (how you scored on your own) or your relative scores (how you compared to national averages). You might, however, get some additional insight by looking at your pattern of scores and getting a sense of what type of consumer you are most like at this point.
To get a sense of what we mean by types of consumers, think about two people with the same overall consumer wisdom score of 99 (the national average raw score). Although they have the same score, they could be very different types of consumers. One, we’ll call her Sarah, is a Non-conformist Consumer. She’d rather borrow things and share when she can, she tries to spend as little as possible on herself and, when she does buy something new, she intentionally explores options promoted as more environmentally or socially progressive. Yet she loves buying gifts for others as a token of friendship and enjoys regularly splurging on friends and family. Sarah, on the other hand, isn’t great at managing her budget and tends to get carried away with buying things that seem virtuous at first, but don’t end up really being that useful.
On the other hand, Rachel is what we’ll call a Smart Consumer. She manages her budget well, reasons through her well-informed choices, and has a good sense of what purchases are a really good value. But, she too often passes on treating herself – rarely spending on things that she just can’t justify despite how much she might enjoy them – and she doesn’t think about the environmental impact of her choices. She cares about climate change but doesn’t really see the connection between global warming and how she spends her money.
So, two consumers with the same overall score, but very different approaches to how they consume. Clearly, the differences are in the dimensions of consumer wisdom and you can likely guess at this point what some of Rachel and Sarah’s relative strengths (and weaknesses) are. What’s interesting is that these patterns of dimension scores tend to reoccur quite consistently. In statistics, we call this clustering. Our analysis suggests that there are five distinct types of consumers in the US today. Similar to common personality profiles based on surveys (like the Myers-Briggs “Protectors,” “Artists,” and “Thinkers”), these five types represent the most common profiles of individual consumption traits. However, unlike personality which is relatively fixed once we reach adulthood, the traits of consumer wisdom are highly learnable and your current type isn’t fixed.
Also, as you’ll soon see, the differences between types go beyond similar score profiles. Different types tend to have relatively different lifestyles, report differences in a variety of measures of well-being, and even report differences in job satisfaction, a sense of having a strong personal support network, and differences in their growth mindset (we’ll explain this more in a bit). We have to be careful to not read too much into these differences – these are average differences drawing from a very diverse population. Note too that our research is correlational – meaning that more research needs to be done to determine to what degree consumer wisdom predicts these outcomes as opposed to being a consequence of them (for example, being a happier person makes you spend in different ways). Like most things in life, and in psychology research, it works in both directions. But, knowing which type you are most like will be another way to help you focus on how you want to move forward with changing your consumption habits – to retain what is working, and build where it will help you better promote your own well-being and values.
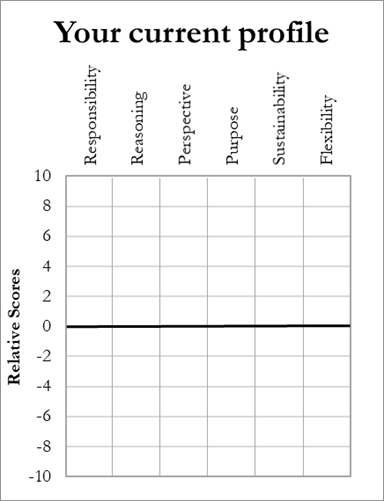
So, before reading about the five types, you might want to take a minute with a piece of paper to create a worksheet similar to the one below (or just print this page). Using the worksheet will help you easily identify what type(s) of consumer you most resemble today. Or, you can skip this step and simply read through to learn about all of the different types (and that might be enough to help you see which one seems most like you).
To use the worksheet, transcribe your relative dimension scores so that you can visualize your score profile. Simply look at your scores, and place an “x” in the column for each dimension at the appropriate point (or in between) based on the scale to the left. If your score is outside the range (greater than 10 or less than -10), just mark it at 10 (or -10); that will be enough to see the pattern.
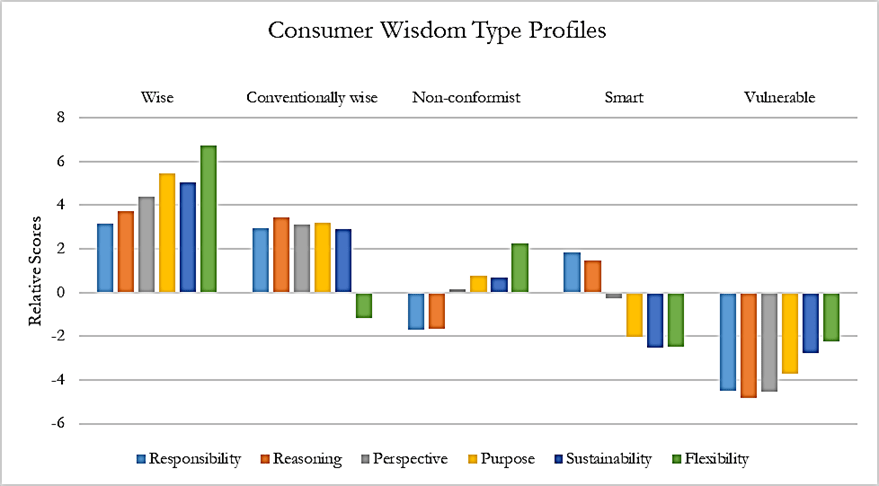
Now, look at the profiles of the five types below. The types are arranged from left to right in order of the highest overall consumer wisdom scores (Wise Consumers on the left, Vulnerable Consumers on the right). The differences in overall consumer wisdom scores also correspond to differences in measured well-being, again from left to right. Wise Consumers report the highest levels of well-being, and Vulnerable Consumers report the lowest, with the others in between (the smallest difference in well-being scores is between Non-conformists and Smart Consumers, with Non-conformists performing slightly better on average).
Does your profile closely match one of these? Focus more on the pattern and less on the individual scores. Or maybe you see two profiles that share common elements with your own? You’re welcome of course to just focus on the type(s) most like you, but for context feel free to read through the other types and see if you recognize any friends or family that might fit each.
The data for this analysis also draw from our nationally representative survey, which included a broad variety of questions. Some of these questions were focused on demographics, like gender and age. While I’ll share these demographic differences by type, remember that these are just averages and what matters most is your behavior, not how old you are (as a side note, I repeated the clustering analysis within each generation and saw essentially the same five clusters emerge each time).
Interestingly, one of the things we measured was political orientation; in other words, to what degree the survey participants identified as being relatively conservative or progressive. There were no differences in political orientation between these clusters, and we measured this in several different ways. What this means is that none of these clusters is more “liberal” or “conservative.” The clusters are essentially the same when it comes to political ideology. This is important to note in our current highly politicized culture in the US, where we tend to imagine that we are more “moral” or “responsible” than “that other group.” A bit of a tangent, but this is consistent with research by Jonathan Haidt (NYU) and others whose research shows that different political groups in the US are similarly moral, they just have different ideas about what that means specifically, and how to achieve it. That’s way beyond our scope, but you shouldn’t read into any of these types as being more aligned with one major US party or the other; they’re not.
Back to our types, here’s an overview of the information we’ll share about each.
- Overall: What proportion of the population falls into each type? We’ll do this by generation so you can see the differences, with three generation splits, in order (ages as of 2021): Gen Z & Millennials (under 40), Gen X (40 to 56), Boomers (57 and better), and also by gender (gender differences are slight, however).
- A brief review of their consumer wisdom profile
- Who they are: Education, income, how spiritual or religious they are, home renting vs. ownership, employment status, job satisfaction, and relationship satisfaction (feeling that they have a good support network).
- Well-being measures:
- Physical health, including body mass index (BMI)
- Satisfaction: feeling satisfied with life and your situation
- Meaning: having a strong sense of leading a meaningful and purposeful life
- Thriving: feeling as though you are enjoying life and succeeding
- Financial well-being: feeling low money stress in the present and confident about the future
- Growth mindset: Growth mindset refers to the belief that you can learn more or become smarter if you work hard and persevere, as opposed to feeling that you are stuck with the talents and abilities that you have today. This important research was pioneered by Stanford psychologist, Carol Dweck. Having a growth mindset is a key enabler of believing that you can change your consumption habits, too!
Ok, on with the descriptions of the five types of consumers based on their consumer wisdom profiles:
Wise Consumers: 14% of the population overall (22% of Gen Z & Millennials, 15% of Gen X, 5% of Boomers)
Their consumer wisdom profile: Wise Consumers have the highest scores across all six of the dimensions, but are particularly distinguished by higher scores for Perspective, Purpose, Sustainability, and Flexibility.
Who they are: Wise Consumers draw from all educational backgrounds and income brackets; you don’t need to be wealthy or have an advanced degree to be a wise consumer! They are somewhat more likely to be male and are slightly more spiritual or religious than the average consumer. They are twice as likely to own a home as opposed to renting and are the most likely to have paid off their mortgage (though this coveted subset of Wise Consumers is in the minority). If they are in the job market (i.e., not a full-time parent or student), they are the most likely of all types to be employed full-time; indeed they are three times more likely to be employed full-time than to be employed PT or searching for a job. They are the most satisfied with their jobs and report having an average personal support network.
Well-being: Wise Consumers report better physical health than the general population, and they are more likely than any other type of consumer to have a healthy BMI (they are three times more likely to have a healthy weight than to be obese). They have the highest scores for a sense of leading a meaningful life, a sense of thriving, and life satisfaction (their life-satisfaction scores are more than double that of any other type of consumer) and they also report above-average ratings for perceived financial well-being.
Mindset: Wise consumers have the highest ratings for a growth mindset – more than double that of any other consumer type.
Overall, Wise Consumers – who come from all sectors of society – are doing very well across all of our measures. Yet, with their high growth mindset scores, they are still open to change. If this is you, very well done! Moving forward, you can focus on specific dimensions that you think present the greatest opportunities for further growth – something that tends to come more naturally to Wise Consumers anyway.
Conventionally Wise Consumers (the “Conventionals”): 16% of the population overall (15% of Gen Z & Millennials, 15% of Gen X, 19% of Boomers)
Their consumer wisdom profile: The Conventionals have higher than average scores for most dimensions, though they are still lower than Wise Consumers for Perspective, Purpose, and Sustainability. Notably, they have below-average scores for Flexibility, hence their label of Conventionals, whose consumption habits are limited to mainstream norms (rarely buying used goods or renting as an alternative to buying, etc.)
Who they are: Conventionals also draw from all income and education brackets. They are somewhat more likely to be female and are slightly more spiritual or religious than the average consumer. They are more likely to own a home than rent and have an average level of full-time employment. They have somewhat higher than average job satisfaction and somewhat better than average personal support networks.
Well-being: Conventionals report better physical health than the general population; they are two times more likely to have a healthy weight than to be obese (as determined by BMI). They have higher than average scores for a sense of leading a meaningful life, a sense of thriving, life satisfaction, and perceived financial well-being. However, except for perceived financial well-being, their well-being scores are still below those of Wise Consumers.
Mindset: Conventionals have above-average ratings for growth mindset, though still below those of Wise Consumers.
Overall, Conventionals – who also come from all sectors of society – are doing well across all of our measures, except for Flexibility. Yet, with their higher than average growth mindset scores, they remain open to change. If this is you, good job! Moving forward, you can focus especially on Flexibility. While there may be still room for growth along other dimensions, being more open and flexible in how and where you spend your money (some used products, borrowing and sharing when you can, etc.) may lead to even higher levels of well-being and ultimately place you in the ranks of being a Wise Consumer.
Non-conformist Consumers: 20% of the population overall (29% of Gen Z & Millennials, 17% of Gen X, 11% of Boomers)
Their consumer wisdom profile: The Non-conformists score lower than average on the dimensions of Responsibility and Reasoning. However, they score somewhat higher than average for both Purpose and Sustainability, and well above-average on Flexibility. Their openness to non-traditional, alternative ways of consuming is a real strength and hallmark.
Who they are: Non-conformists draw from all income levels, yet tend to be somewhat better educated. They are somewhat more likely to be male, and their reported levels of spirituality and religion are similar to the average consumer. They are less likely to own a home than the average consumer, yet have average levels of full-time employment and job satisfaction. However, they report having somewhat less of a personal support network.
Well-being: Non-conformists report average physical health, yet worse than average BMI; they are only somewhat more likely to have a healthy weight than to be obese. Their well-being is average for most measures: having a sense of leading a meaningful life, a sense of thriving, and life-satisfaction. And, though their income levels are average, they report a somewhat lower sense of perceived financial well-being.
Mindset: Non-conformists have average ratings for growth mindset.
Overall, Non-conformists appear fairly typical in terms of who they are and their reported levels of well-being. Yet, they tend to view and approach the marketplace quite differently, and even with some skepticism – this can be both a strength and a limitation. Though their openness and flexibility is a strength, improvements in well-being will only come when pairing this with improved Responsibility and Reasoning. Though they seem to reject the conventional limitations of mainstream consumption, they need still to embrace the approach and processes of the Wise Consumer in more widely exploring how and when to spend in ways that fit, or enhance, their lifestyle. If this seems like you, then there is plenty of upside ahead. Just don’t lose your sense of openness and flexibility along the way!
Smart Consumers: 26% of the population overall (15% of Gen Z & Millennials, 25% of Gen X, 40% of Boomers)
Their consumer wisdom profile: Smart Consumers score higher than average in Responsibility and Reasoning, average for Perspective, and below-average for Purpose, Sustainability, and Flexibility. They are labeled “smart” not because they have higher intelligence, but because they behave in ways that are consistent with how popular culture usually describes the “smart consumer.” Their strength is focused on transactions and getting the best deal, but they tend to lose the bigger picture – both for themselves and about others. They are, however, the most common type of consumer proportionally – especially amongst older consumers. Along almost all dimensions, they are the opposite of the non-conformist in terms of their consumption habits.
Who they are: Smart Consumers have average incomes but tend to be somewhat less educated. They are equally likely to be male or female, and their reported levels of spirituality and religion are similar to the average consumer. They are much more likely to own a home than to rent (an important transaction!). Smart Consumers report average levels of full-time vs. part-time employment, have average job satisfaction, and a somewhat better than average personal support network.
Well-being: Smart Consumers report average physical health, yet they have the worst BMI of all types of consumers. In fact, they are slightly more likely to be obese than to have a normal weight. Their ratings for all other well-being measures – meaning in life, thriving, life satisfaction, and perceived financial well-being – are all average.
Mindset: Smart Consumers have average growth mindset ratings.
Smart Consumers are often celebrated in our culture. They tend to be market-savvy, knowing where and when to buy for value and get a good deal. If this seems like you, these are good skills to have, but there’s a chance that you have “lost the forest for the trees.” You may need to take a wider view and consider more often how each specific “great deal” does, or doesn’t, contribute to a life well-lived – one that promotes your well-being and better promotes your values. Hold onto your strengths, but focus on Purpose, Sustainability, and Flexibility. Improvements along each of these will pay dividends. How’s that for a deal!
Vulnerable Consumers: 24% of the population overall (20% of Gen Z & Millennials, 29% of Gen X, 25% of Boomers)
Their consumer wisdom profile: Vulnerable Consumers score below-average on all dimensions of Consumer Wisdom. They are vulnerable in the sense that their consumption habits have a consistently negative impact on their well-being. This is not a judgment of their behaviors, but an unfortunately common outcome of the economy that we live in. Indeed, this is the second most common type of consumer. They do, however, have the most to gain from learning more about and applying more consistently the habits of the Wise Consumer.
Who they are: Vulnerable Consumers have lower than average incomes and tend to be somewhat less educated. They are somewhat more likely to be female, and their reported levels of spirituality and religion are lower than those of the average consumer. They have lower levels of home-ownership, but report average levels of full-time vs. part-time employment. They have lower than average job satisfaction and less of a personal support network.
Well-being: Vulnerable Consumers report below-average physical health, and worse than average BMI. They are only somewhat more likely to be a healthy weight vs. obese. They report lower than average levels of well-being for all measures: meaning in life, thriving, life satisfaction, and perceived financial well-being.
Mindset: Vulnerable Consumers have below-average growth mindset ratings. They feel constrained and stuck.
Vulnerable Consumers are suffering the most from the very real challenges of being a consumer in our economy. They report low levels of well-being, and also don’t feel optimistic about the possibility of change. If you are one of these consumers, you have taken the first big step by taking the Consumer Wisdom survey and getting a more clear and honest sense of your current situation. You have real potential for growth along all dimensions of Consumer Wisdom, and each will help you along in your journey to become a better consumer – and to improve your well-being in many ways. Be optimistic, change can be around the corner sooner than you think!

It is very good 👍 👌
LikeLike